Maps
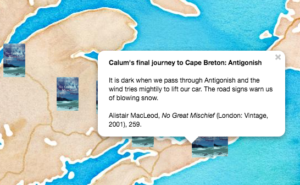
This map of the locations in the final section of Alistair McLeod’s No Great Mischief was built as an experiment to practise D3.js.
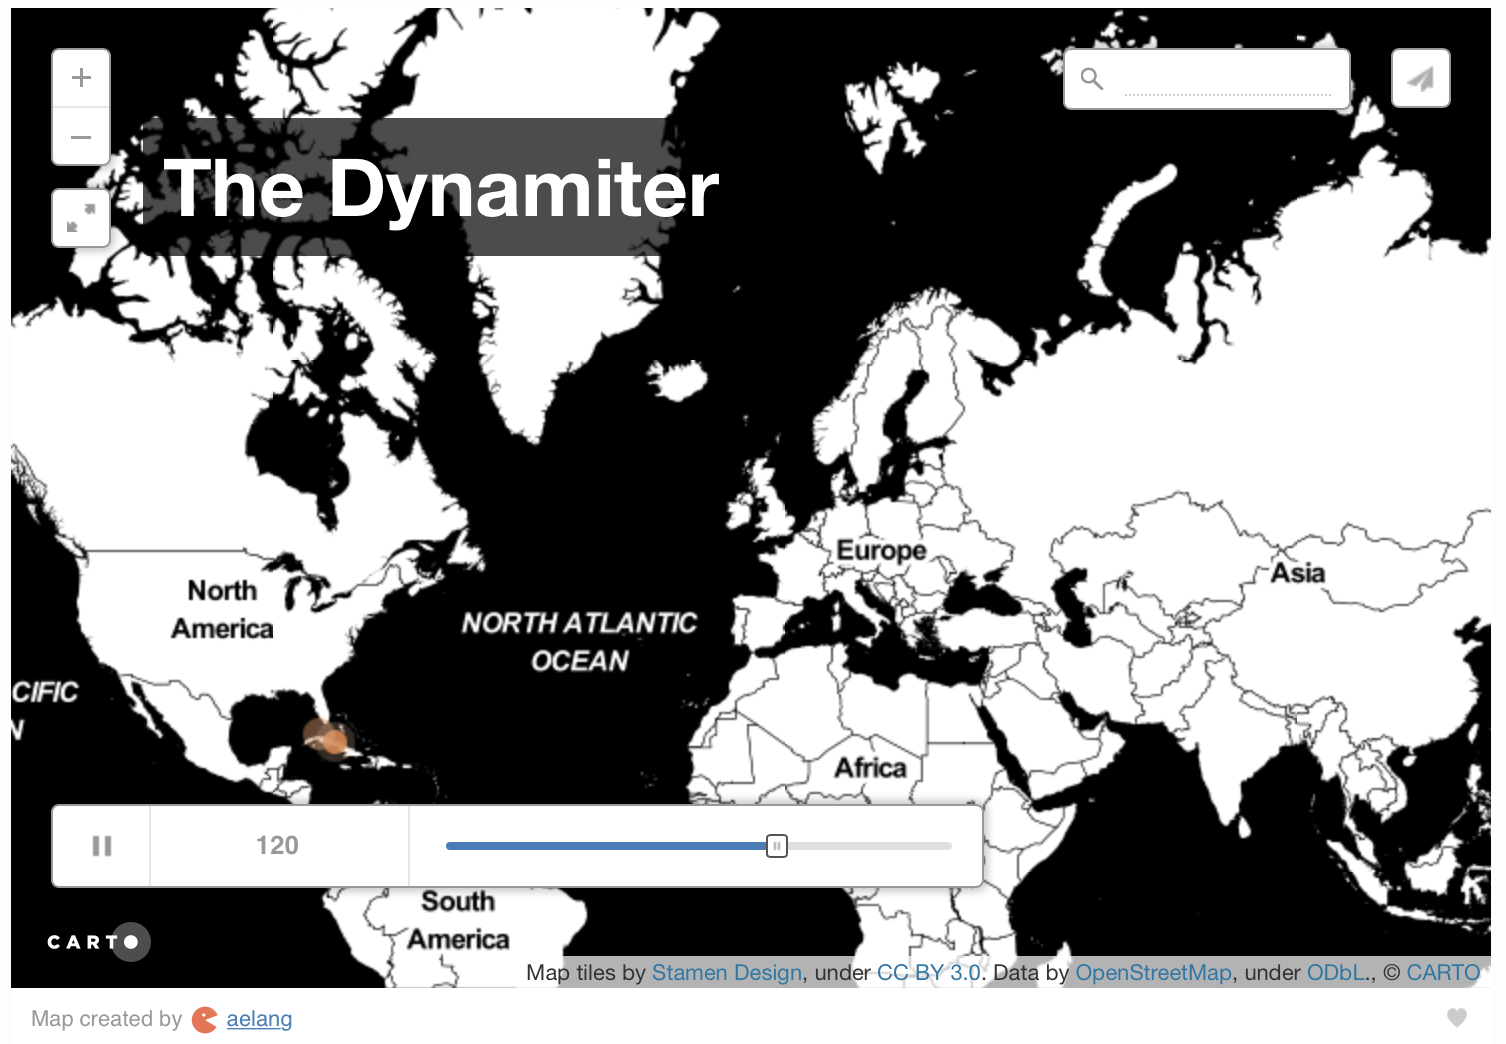 This dynamic map was created with CartoDB and shows the locations in Robert Louis Stevenson and Fanny van der Grift Stevenson’s novella The Dynamiter as the narrative progresses. My postgraduate Digital Humanities students helped to gather and code the data: the darker orange the dot, the more heightened the emotion associated with that place.
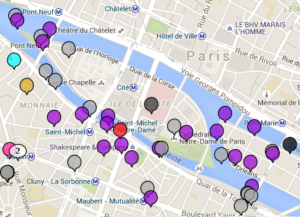
My interactive map of modernist Paris (right) used the SIMILE project’s Exhibit and Timeline scripts to plot points related to John Glassco’s Memoirs of Montparnasse, and information relating to other significant figures within literature and culture in the early decades of the twentieth century. As SIMILE is now deprecated, and Google has changed its Maps and Spreadsheets protocols, this map no longer works, so I have ported the data to a CartoDB map (below). The navigation is not as functional but the data is all there.
And two visualisations of the places referred to Lilian Pizzichini’s biography of Jean Rhys, The Blue Hour, which my undergraduate Digital Humanities students helped to gather the data for:
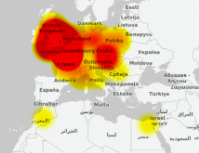
The first, created by Tom Armitage, shows how the locations in the biography shift over time. Tom has written about the process of creating this map here, and you can see a video of the shifts here.
The second, created with the QGIS plugin Qgis2threejs, is a mockup (using very inadequate data) of the places in London that are mentioned most often in The Blue Hour.